61483 can be classified socioeconomically as Lower Middle Class class compared to other ZIP Codes in Illinois based on Median Household Income and Average Adjusted Gross Income. The majority race/ethnicity residing in 61483 is White. The majority race/ethnicity attending public schools in 61483 is White. The current unemployment level in 61483 is 4.8%.
| Population | 1,861 |
| Population Growth Rate | 0.00% |
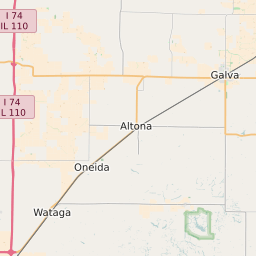
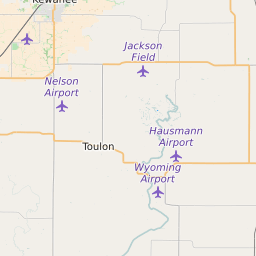
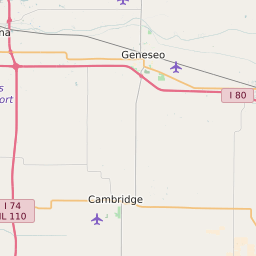
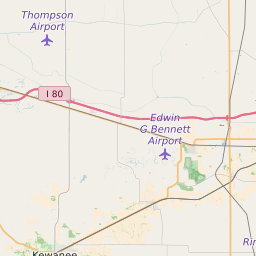
| Population Density | 19 People per Square Mile |
| Total Households | 764 |
| Percentage High Income Households | 5.0% |
| Median Household Income (2021) | $54,338 |
| Average Adjusted Gross Income (2021) | $272,900 |
| Current Unemployment Rate (January 2025) | 4.8% |
| Majority Race/Ethnicty | White - 97.40% |
| Public School Majority Race/Ethnicty | White - 93.80% |
61483 Race/Ethnicty Breakdown
| Race/Ethnicty | Total | Percentage |
|---|
| White | 1,835 | 97.4% |
| Black | 21 | 1.11% |
| Hispanic | 9 | 0.48% |
| Asian | 19 | 1.01% |
| Native American | 0 | 0% |
| Hawaiian/Pac. Islander | 0 | 0% |
61483 Public School Race/Ethnicty Breakdown
| Race/Ethnicty | Total | Percentage |
|---|
| White | 348 | 95.6% |
| Black | 6 | 1.65% |
| Hispanic | 5 | 1.37% |
| Asian | 3 | 0.82% |
| Native American | 2 | 0.55% |
| Hawaiian/Pac. Islander | 0 | 0% |
61483 Educational Attainment Levels
| Highest Education Level Attained | Total | Percentage |
|---|
| Less Than 1 Year of College | 105 | 8.35% |
| Bachelor Degree | 201 | 15.99% |
| High School Diploma | 468 | 37.23% |
| No High School Diploma | 23 | 1.83% |
| GED or Alternate | 40 | 3.18% |
| 1 or More Years of College | 239 | 19.01% |
| Associates Degree | 128 | 10.18% |
| Masters Degree | 43 | 3.42% |
| Professional Degree | 10 | 0.8% |
| Doctorate Degree | 0 | 0% |