61744 can be classified socioeconomically as Lower Middle Class class compared to other ZIP Codes in Illinois based on Median Household Income and Average Adjusted Gross Income. The majority race/ethnicity residing in 61744 is White. The majority race/ethnicity attending public schools in 61744 is White. The current unemployment level in 61744 is 4.3%.
| Population | 1,506 |
| Population Growth Rate | 0.00% |
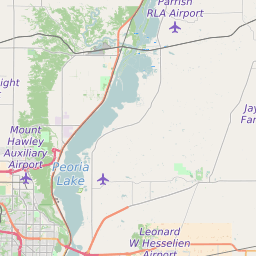
| Population Density | 19 People per Square Mile |
| Total Households | 717 |
| Percentage High Income Households | 0.3% |
| Median Household Income (2021) | $66,932 |
| Average Adjusted Gross Income (2021) | $330,480 |
| Current Unemployment Rate (February 2025) | 4.3% |
| Majority Race/Ethnicty | White - 95.81% |
| Public School Majority Race/Ethnicty | White - 89.68% |
61744 Race/Ethnicty Breakdown
| Race/Ethnicty | Total | Percentage |
|---|
| White | 1,463 | 95.81% |
| Black | 34 | 2.23% |
| Hispanic | 28 | 1.83% |
| Asian | 2 | 0.13% |
| Native American | 0 | 0% |
| Hawaiian/Pac. Islander | 0 | 0% |
61744 Public School Race/Ethnicty Breakdown
| Race/Ethnicty | Total | Percentage |
|---|
| White | 313 | 93.71% |
| Black | 5 | 1.5% |
| Hispanic | 16 | 4.79% |
| Asian | 0 | 0% |
| Native American | 0 | 0% |
| Hawaiian/Pac. Islander | 0 | 0% |
61744 Educational Attainment Levels
| Highest Education Level Attained | Total | Percentage |
|---|
| Less Than 1 Year of College | 75 | 5.98% |
| Bachelor Degree | 205 | 16.35% |
| High School Diploma | 468 | 37.32% |
| No High School Diploma | 9 | 0.72% |
| GED or Alternate | 84 | 6.7% |
| 1 or More Years of College | 292 | 23.29% |
| Associates Degree | 86 | 6.86% |
| Masters Degree | 20 | 1.59% |
| Professional Degree | 6 | 0.48% |
| Doctorate Degree | 9 | 0.72% |