62418 can be classified socioeconomically as Lower Middle Class class compared to other ZIP Codes in Illinois based on Median Household Income and Average Adjusted Gross Income. The majority race/ethnicity residing in 62418 is White. The majority race/ethnicity attending public schools in 62418 is White. The current unemployment level in 62418 is 4.3%.
| Population | 2,076 |
| Population Growth Rate | 0.00% |
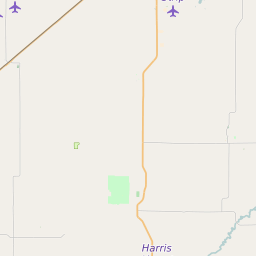
| Population Density | 18 People per Square Mile |
| Total Households | 809 |
| Percentage High Income Households | 0.9% |
| Median Household Income (2021) | $48,832 |
| Average Adjusted Gross Income (2021) | $319,700 |
| Current Unemployment Rate (February 2025) | 4.3% |
| Majority Race/Ethnicty | White - 98.90% |
| Public School Majority Race/Ethnicty | White - 95.79% |
62418 Race/Ethnicty Breakdown
| Race/Ethnicty | Total | Percentage |
|---|
| White | 2,073 | 96.96% |
| Black | 0 | 0% |
| Hispanic | 5 | 0.23% |
| Asian | 18 | 0.84% |
| Native American | 0 | 0% |
| Hawaiian/Pac. Islander | 42 | 1.96% |
62418 Public School Race/Ethnicty Breakdown
| Race/Ethnicty | Total | Percentage |
|---|
| White | 364 | 98.11% |
| Black | 4 | 1.08% |
| Hispanic | 2 | 0.54% |
| Asian | 0 | 0% |
| Native American | 0 | 0% |
| Hawaiian/Pac. Islander | 1 | 0.27% |
62418 Educational Attainment Levels
| Highest Education Level Attained | Total | Percentage |
|---|
| Less Than 1 Year of College | 164 | 13.08% |
| Bachelor Degree | 98 | 7.81% |
| High School Diploma | 610 | 48.64% |
| No High School Diploma | 16 | 1.28% |
| GED or Alternate | 61 | 4.86% |
| 1 or More Years of College | 103 | 8.21% |
| Associates Degree | 169 | 13.48% |
| Masters Degree | 33 | 2.63% |
| Professional Degree | 0 | 0% |
| Doctorate Degree | 0 | 0% |