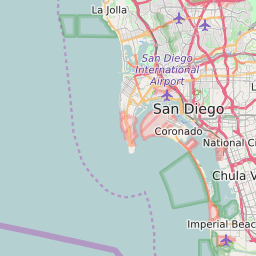
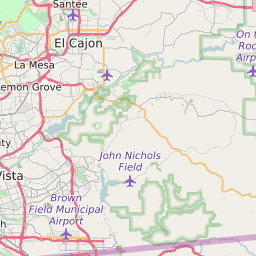
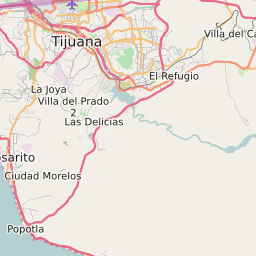
92154 can be classified socioeconomically as Lower Middle Class class compared to other ZIP Codes in California based on Median Household Income and Average Adjusted Gross Income. The majority race/ethnicity residing in 92154 is Hispanic. The majority race/ethnicity attending public schools in 92154 is Hispanic. The current unemployment level in 92154 is 5.0%.
| Population | 83,758 |
| Population Growth Rate | 0.00% |
| Population Density | 2,269 People per Square Mile |
| Total Households | 20,133 |
| Percentage High Income Households | 1.8% |
| Median Household Income (2021) | $74,705 |
| Average Adjusted Gross Income (2021) | $320,290 |
| Current Unemployment Rate (June 2025) | 5.0% |
| Majority Race/Ethnicty | Hispanic - 49.70% |
| Public School Majority Race/Ethnicty | Hispanic - 84.05% |
92154 Race/Ethnicty Breakdown
| Race/Ethnicty | Total | Percentage |
|---|
| White | 44,964 | 37.87% |
| Black | 4,481 | 3.77% |
| Hispanic | 58,667 | 49.41% |
| Asian | 9,440 | 7.95% |
| Native American | 493 | 0.42% |
| Hawaiian/Pac. Islander | 684 | 0.58% |
92154 Public School Race/Ethnicty Breakdown
| Race/Ethnicty | Total | Percentage |
|---|
| White | 744 | 5.38% |
| Black | 354 | 2.56% |
| Hispanic | 11,916 | 86.19% |
| Asian | 735 | 5.32% |
| Native American | 45 | 0.33% |
| Hawaiian/Pac. Islander | 32 | 0.23% |
92154 Educational Attainment Levels
| Highest Education Level Attained | Total | Percentage |
|---|
| Less Than 1 Year of College | 3,664 | 9.63% |
| Bachelor Degree | 5,756 | 15.13% |
| High School Diploma | 10,660 | 28.02% |
| No High School Diploma | 2,074 | 5.45% |
| GED or Alternate | 1,851 | 4.86% |
| 1 or More Years of College | 8,256 | 21.7% |
| Associates Degree | 3,940 | 10.35% |
| Masters Degree | 1,325 | 3.48% |
| Professional Degree | 350 | 0.92% |
| Doctorate Degree | 175 | 0.46% |