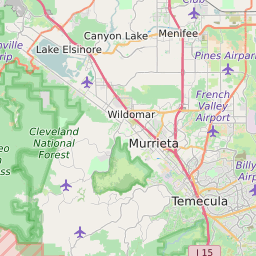
92563 can be classified socioeconomically as Middle Class class compared to other ZIP Codes in California based on Median Household Income and Average Adjusted Gross Income. The majority race/ethnicity residing in 92563 is White. The majority race/ethnicity attending public schools in 92563 is Hispanic. The current unemployment level in 92563 is 5.0%.
| Population | 78,139 |
| Population Growth Rate | 0.00% |
| Population Density | 3,768 People per Square Mile |
| Total Households | 15,809 |
| Percentage High Income Households | 4.5% |
| Median Household Income (2021) | $105,106 |
| Average Adjusted Gross Income (2021) | $303,840 |
| Current Unemployment Rate (June 2025) | 5.0% |
| Majority Race/Ethnicty | White - 50.39% |
| Public School Majority Race/Ethnicty | Hispanic - 39.13% |
92563 Race/Ethnicty Breakdown
| Race/Ethnicty | Total | Percentage |
|---|
| White | 40,943 | 50.25% |
| Black | 6,006 | 7.37% |
| Hispanic | 24,265 | 29.78% |
| Asian | 9,913 | 12.17% |
| Native American | 119 | 0.15% |
| Hawaiian/Pac. Islander | 225 | 0.28% |
92563 Public School Race/Ethnicty Breakdown
| Race/Ethnicty | Total | Percentage |
|---|
| White | 4,431 | 37.05% |
| Black | 828 | 6.92% |
| Hispanic | 5,215 | 43.6% |
| Asian | 1,373 | 11.48% |
| Native American | 39 | 0.33% |
| Hawaiian/Pac. Islander | 74 | 0.62% |
92563 Educational Attainment Levels
| Highest Education Level Attained | Total | Percentage |
|---|
| Less Than 1 Year of College | 2,552 | 8.6% |
| Bachelor Degree | 5,488 | 18.49% |
| High School Diploma | 7,681 | 25.88% |
| No High School Diploma | 586 | 1.97% |
| GED or Alternate | 887 | 2.99% |
| 1 or More Years of College | 6,697 | 22.56% |
| Associates Degree | 3,152 | 10.62% |
| Masters Degree | 1,879 | 6.33% |
| Professional Degree | 363 | 1.22% |
| Doctorate Degree | 397 | 1.34% |