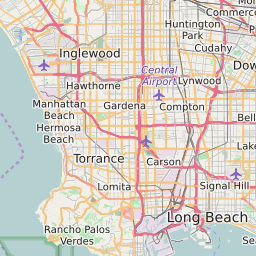
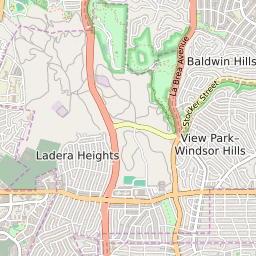
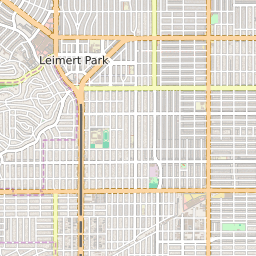
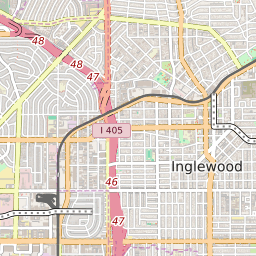
90043 can be classified socioeconomically as Lower Middle Class class compared to other ZIP Codes in California based on Median Household Income and Average Adjusted Gross Income. The majority race/ethnicity residing in 90043 is African American. The majority race/ethnicity attending public schools in 90043 is African American. The current unemployment level in 90043 is 5.2%.
| Population | 44,461 |
| Population Growth Rate | 0.00% |
| Population Density | 10,941 People per Square Mile |
| Total Households | 16,318 |
| Percentage High Income Households | 4.1% |
| Median Household Income (2021) | $60,599 |
| Average Adjusted Gross Income (2021) | $384,330 |
| Current Unemployment Rate (February 2025) | 5.2% |
| Majority Race/Ethnicty | African American - 55.31% |
| Public School Majority Race/Ethnicty | African American - 50.14% |
90043 Race/Ethnicty Breakdown
| Race/Ethnicty | Total | Percentage |
|---|
| White | 6,849 | 14.54% |
| Black | 25,973 | 55.14% |
| Hispanic | 12,843 | 27.27% |
| Asian | 1,005 | 2.13% |
| Native American | 289 | 0.61% |
| Hawaiian/Pac. Islander | 141 | 0.3% |
90043 Public School Race/Ethnicty Breakdown
| Race/Ethnicty | Total | Percentage |
|---|
| White | 34 | 0.53% |
| Black | 3,290 | 50.81% |
| Hispanic | 3,116 | 48.12% |
| Asian | 3 | 0.05% |
| Native American | 26 | 0.4% |
| Hawaiian/Pac. Islander | 6 | 0.09% |
90043 Educational Attainment Levels
| Highest Education Level Attained | Total | Percentage |
|---|
| Less Than 1 Year of College | 1,729 | 7.09% |
| Bachelor Degree | 3,463 | 14.2% |
| High School Diploma | 5,747 | 23.56% |
| No High School Diploma | 1,240 | 5.08% |
| GED or Alternate | 589 | 2.41% |
| 1 or More Years of College | 6,397 | 26.22% |
| Associates Degree | 2,599 | 10.65% |
| Masters Degree | 1,952 | 8% |
| Professional Degree | 502 | 2.06% |
| Doctorate Degree | 176 | 0.72% |