92283 can be classified socioeconomically as Lower Class class compared to other ZIP Codes in California based on Median Household Income and Average Adjusted Gross Income. The majority race/ethnicity residing in 92283 is Native American. The majority race/ethnicity attending public schools in 92283 is Native American. The current unemployment level in 92283 is 5.2%.
| Population | 1,967 |
| Population Growth Rate | 0.00% |
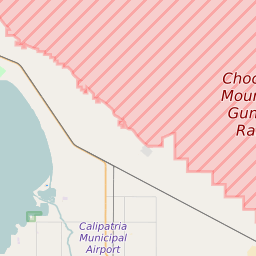
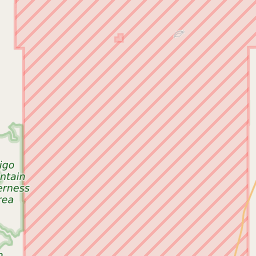
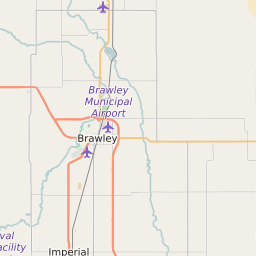
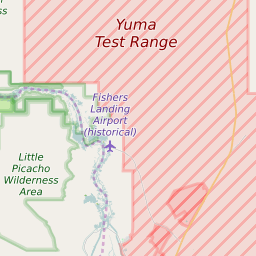
| Population Density | 1 People per Square Mile |
| Total Households | 937 |
| Percentage High Income Households | 0.6% |
| Median Household Income (2021) | $26,685 |
| Average Adjusted Gross Income (2021) | $121,070 |
| Current Unemployment Rate (February 2025) | 5.2% |
| Majority Race/Ethnicty | Native American - 45.04% |
| Public School Majority Race/Ethnicty | Native American - 49.92% |
92283 Race/Ethnicty Breakdown
| Race/Ethnicty | Total | Percentage |
|---|
| White | 636 | 30.93% |
| Black | 21 | 1.02% |
| Hispanic | 464 | 22.57% |
| Asian | 9 | 0.44% |
| Native American | 926 | 45.04% |
| Hawaiian/Pac. Islander | 0 | 0% |
92283 Public School Race/Ethnicty Breakdown
| Race/Ethnicty | Total | Percentage |
|---|
| White | 11 | 1.89% |
| Black | 4 | 0.69% |
| Hispanic | 262 | 45.09% |
| Asian | 0 | 0% |
| Native American | 304 | 52.32% |
| Hawaiian/Pac. Islander | 0 | 0% |
92283 Educational Attainment Levels
| Highest Education Level Attained | Total | Percentage |
|---|
| Less Than 1 Year of College | 170 | 14.74% |
| Bachelor Degree | 47 | 4.08% |
| High School Diploma | 365 | 31.66% |
| No High School Diploma | 113 | 9.8% |
| GED or Alternate | 114 | 9.89% |
| 1 or More Years of College | 232 | 20.12% |
| Associates Degree | 87 | 7.55% |
| Masters Degree | 25 | 2.17% |
| Professional Degree | 0 | 0% |
| Doctorate Degree | 0 | 0% |