92539 can be classified socioeconomically as Lower Middle Class class compared to other ZIP Codes in California based on Median Household Income and Average Adjusted Gross Income. The majority race/ethnicity residing in 92539 is White. The majority race/ethnicity attending public schools in 92539 is Hispanic. The current unemployment level in 92539 is 5.2%.
| Population | 3,760 |
| Population Growth Rate | 0.00% |
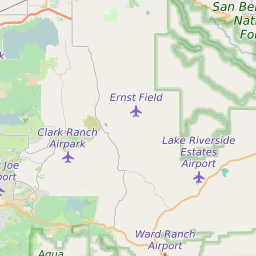
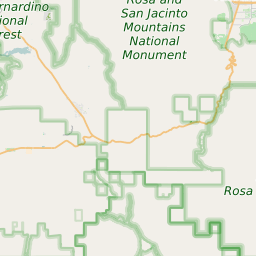
| Population Density | 24 People per Square Mile |
| Total Households | 1,548 |
| Median Household Income (2021) | $48,954 |
| Average Adjusted Gross Income (2021) | $338,530 |
| Current Unemployment Rate (February 2025) | 5.2% |
| Majority Race/Ethnicty | White - 61.24% |
| Public School Majority Race/Ethnicty | Hispanic - 43.31% |
92539 Race/Ethnicty Breakdown
| Race/Ethnicty | Total | Percentage |
|---|
| White | 3,231 | 61.24% |
| Black | 8 | 0.15% |
| Hispanic | 1,768 | 33.51% |
| Asian | 163 | 3.09% |
| Native American | 106 | 2.01% |
| Hawaiian/Pac. Islander | 0 | 0% |
92539 Public School Race/Ethnicty Breakdown
| Race/Ethnicty | Total | Percentage |
|---|
| White | 254 | 41.85% |
| Black | 1 | 0.16% |
| Hispanic | 275 | 45.3% |
| Asian | 25 | 4.12% |
| Native American | 52 | 8.57% |
| Hawaiian/Pac. Islander | 0 | 0% |
92539 Educational Attainment Levels
| Highest Education Level Attained | Total | Percentage |
|---|
| Less Than 1 Year of College | 250 | 9.82% |
| Bachelor Degree | 182 | 7.15% |
| High School Diploma | 916 | 35.99% |
| No High School Diploma | 112 | 4.4% |
| GED or Alternate | 148 | 5.82% |
| 1 or More Years of College | 766 | 30.1% |
| Associates Degree | 144 | 5.66% |
| Masters Degree | 27 | 1.06% |
| Professional Degree | 0 | 0% |
| Doctorate Degree | 0 | 0% |