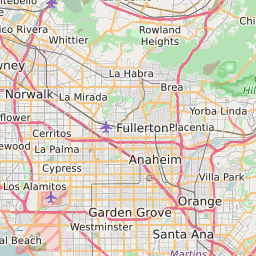
92801 can be classified socioeconomically as Lower Middle Class class compared to other ZIP Codes in California based on Median Household Income and Average Adjusted Gross Income. The majority race/ethnicity residing in 92801 is Hispanic. The majority race/ethnicity attending public schools in 92801 is Hispanic. The current unemployment level in 92801 is 5.0%.
| Population | 64,022 |
| Population Growth Rate | 0.00% |
| Population Density | 10,643 People per Square Mile |
| Total Households | 17,906 |
| Percentage High Income Households | 1.6% |
| Median Household Income (2021) | $71,309 |
| Average Adjusted Gross Income (2021) | $332,760 |
| Current Unemployment Rate (June 2025) | 5.0% |
| Majority Race/Ethnicty | Hispanic - 46.13% |
| Public School Majority Race/Ethnicty | Hispanic - 82.38% |
92801 Race/Ethnicty Breakdown
| Race/Ethnicty | Total | Percentage |
|---|
| White | 29,843 | 35.47% |
| Black | 2,891 | 3.44% |
| Hispanic | 38,782 | 46.09% |
| Asian | 11,949 | 14.2% |
| Native American | 603 | 0.72% |
| Hawaiian/Pac. Islander | 78 | 0.09% |
92801 Public School Race/Ethnicty Breakdown
| Race/Ethnicty | Total | Percentage |
|---|
| White | 504 | 5.92% |
| Black | 175 | 2.06% |
| Hispanic | 7,173 | 84.28% |
| Asian | 616 | 7.24% |
| Native American | 23 | 0.27% |
| Hawaiian/Pac. Islander | 20 | 0.23% |
92801 Educational Attainment Levels
| Highest Education Level Attained | Total | Percentage |
|---|
| Less Than 1 Year of College | 1,873 | 6.92% |
| Bachelor Degree | 4,683 | 17.31% |
| High School Diploma | 9,405 | 34.76% |
| No High School Diploma | 1,171 | 4.33% |
| GED or Alternate | 913 | 3.37% |
| 1 or More Years of College | 5,045 | 18.64% |
| Associates Degree | 2,112 | 7.8% |
| Masters Degree | 1,338 | 4.94% |
| Professional Degree | 277 | 1.02% |
| Doctorate Degree | 243 | 0.9% |