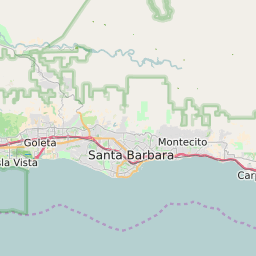
Official Zip Code Name | Ventura |
Zip Code State | California |
Zip Code Type | Non-Unique |
Primary County: | Ventura |
Area Code | 820 / 805 |
Current Population: | 50474 |
Racial Majority: | White 60.32% |
Public School Racial Majority: | Hispanic 46% |
Unemployment Rate: | 2.6% |
Median Household Income | $68987 |
Average Adjusted Gross Income | $80810 |
School Test Performance: | Average |
Average Commute Time | 21.4 Minutes |
Time Zone: | Pacific Daylight Time |
Elevation Range | 102 - 1299 ft. |
Area | 20 Sqm. |
Coordinates(Y,X) | 34.27937400, -119.21929500 |
The current unemployment level in 93003 is 2.6% which is lower than the current county unemployment level of 5.8% and is lower than the current state unemployment at 3.7% and lower than the current national unemployment rate at 3.7%.
According the 2010 US Census, the population of 93003 increased to 50474 from 46891 over the past 10 years. The majority ethnicity residing in 93003 is White while the majority ethnicity attending 93003 public schools is Hispanic. 44% of students in 93003 public schools receive or are eligible to participate in free or reduced lunch programs.
2014 | 2010 | Change(+/-) | ||
---|---|---|---|---|
White | 31035 | 60.32% | 31754 | -2% |
Black Or African American | 1060 | 2.06% | 739 | +43% |
Hispanic | 15328 | 29.79% | 14285 | +7% |
American Indian Or Alaskan Native | 224 | 0.44% | 243 | -8% |
Asian | 2231 | 4.34% | 1929 | +16% |
Native Hawaiian & Other Pacific Islander | 154 | 0.3% | 95 | +62% |
Other Race | 96 | 0.3% | 96 | +59% |
Two Or More Races | 1333 | 2.47% | 1333 | -5% |
White | 43.8% |
---|---|
Black Or African American | 1.6% |
Hispanic | 46% |
Asian | 4% |
Hawaii/Pacific Islander | 0.2% |
American Indian Or Alaskan Native | 0.4% |
Two or More Races | 3.9% |
2010 | 2000 | |
---|---|---|
Total Population | 50474 | 46891 |
Male Population | 49.20% | |
Female Population | 50.80% | |
Total Households | 19128 |
Test Score Performance | Average |
Percentage of Students Eligible For Free or Reduced Lunch | 44% |
Percentage of Public Schools with Title 1 Status | 41.7% |
Median Household Income | $68987 |
Income Under $50K Per Year | 32.80% |
Income $50K to $100K Per Year | 40.10% |
Income Above $100K Per Year | 27.20% |
93003 US Congressional District | ||
District | Representative | Party Affiliation |
California District 26 | Julia Brownley | Democrat |
Related Maps: Map of All California Congressional Districts |
93003 California State Assembly Districts | ||
District | Representative | Party Affiliation |
37 | Monique Limón | Democrat |
Related Maps: Map of All California State Assembly Districts |
93003 California State Senate Districts | ||
District | Representative | Party Affiliation |
19 | Hannah-Beth Jackson | Democrat |
Related Maps: Map of All California State Senate Districts |
93060 - Santa Paula |
93036 - Oxnard |
93004 - Ventura |
93001 - Ventura |
93030 - Oxnard |
San Buenaventura (Ventura), CA |
Oxnard, CA |
Zip Code 93003 Annual Climate Data |
Jan | Feb | Mar | Apr | May | Jun | Jul | Aug | Sep | Oct | Nov | Dec | Annual |
---|---|---|---|---|---|---|---|---|---|---|---|---|---|
Avg Min Temp (°F) | 44 | 45 | 47 | 49 | 52 | 55 | 58 | 59 | 58 | 53 | 47 | 44 | 51 |
Avg Max Temp (°F) | 66 | 67 | 68 | 70 | 70 | 73 | 76 | 77 | 77 | 75 | 71 | 67 | 71 |
Avg Precip (In.) | 3.46 | 4.02 | 3.2 | .75 | .21 | .05 | .02 | .07 | .34 | .41 | 1.3 | 2.14 | 15.96 |
List of High Schools in Zipcode 93003 | |
---|---|
Buena High School | Ventura |
Ventura High School | Ventura |
List of Middle Schools in Zipcode 93003 | |
---|---|
Anacapa Middle School | Ventura |
Cabrillo Middle School | Ventura |
List of Elementary Schools in Zipcode 93003 | |
---|---|
Elmhurst Elementary School | Ventura |
Poinsettia Elementary School | Ventura |
Will Rogers Elementary School | Ventura |
South Bank |