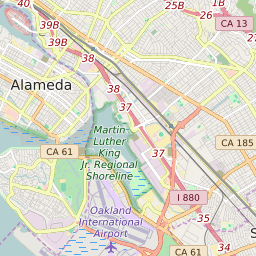
94501 can be classified socioeconomically as Middle Class class compared to other ZIP Codes in California based on Median Household Income and Average Adjusted Gross Income. The majority race/ethnicity residing in 94501 is White. The majority race/ethnicity attending public schools in 94501 is Asian. The current unemployment level in 94501 is 5.2%.
| Population | 63,340 |
| Population Growth Rate | 0.00% |
| Population Density | 7,910 People per Square Mile |
| Total Households | 24,405 |
| Percentage High Income Households | 7.9% |
| Median Household Income (2021) | $101,705 |
| Average Adjusted Gross Income (2021) | $528,630 |
| Current Unemployment Rate (February 2025) | 5.2% |
| Majority Race/Ethnicty | White - 48.64% |
| Public School Majority Race/Ethnicty | Asian - 30.38% |
94501 Race/Ethnicty Breakdown
| Race/Ethnicty | Total | Percentage |
|---|
| White | 29,867 | 48.35% |
| Black | 4,315 | 6.99% |
| Hispanic | 8,502 | 13.76% |
| Asian | 18,337 | 29.69% |
| Native American | 388 | 0.63% |
| Hawaiian/Pac. Islander | 359 | 0.58% |
94501 Public School Race/Ethnicty Breakdown
| Race/Ethnicty | Total | Percentage |
|---|
| White | 2,697 | 33.63% |
| Black | 681 | 8.49% |
| Hispanic | 1,673 | 20.86% |
| Asian | 2,889 | 36.02% |
| Native American | 24 | 0.3% |
| Hawaiian/Pac. Islander | 56 | 0.7% |
94501 Educational Attainment Levels
| Highest Education Level Attained | Total | Percentage |
|---|
| Less Than 1 Year of College | 1,850 | 4.62% |
| Bachelor Degree | 12,212 | 30.5% |
| High School Diploma | 6,505 | 16.25% |
| No High School Diploma | 537 | 1.34% |
| GED or Alternate | 759 | 1.9% |
| 1 or More Years of College | 7,075 | 17.67% |
| Associates Degree | 3,929 | 9.81% |
| Masters Degree | 4,512 | 11.27% |
| Professional Degree | 1,697 | 4.24% |
| Doctorate Degree | 966 | 2.41% |