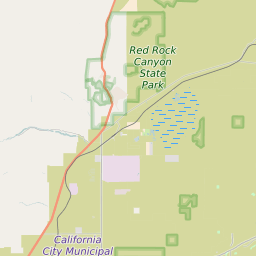
93501 can be classified socioeconomically as Lower Middle Class class compared to other ZIP Codes in California based on Median Household Income and Average Adjusted Gross Income. The majority race/ethnicity residing in 93501 is Hispanic. The majority race/ethnicity attending public schools in 93501 is Hispanic. The current unemployment level in 93501 is 5.2%.
| Population | 5,404 |
| Population Growth Rate | 0.00% |
| Population Density | 15 People per Square Mile |
| Total Households | 1,852 |
| Percentage High Income Households | 1.0% |
| Median Household Income (2021) | $48,447 |
| Average Adjusted Gross Income (2021) | $213,330 |
| Current Unemployment Rate (February 2025) | 5.2% |
| Majority Race/Ethnicty | Hispanic - 42.35% |
| Public School Majority Race/Ethnicty | Hispanic - 55.30% |
93501 Race/Ethnicty Breakdown
| Race/Ethnicty | Total | Percentage |
|---|
| White | 2,361 | 39.55% |
| Black | 822 | 13.77% |
| Hispanic | 2,520 | 42.21% |
| Asian | 112 | 1.88% |
| Native American | 136 | 2.28% |
| Hawaiian/Pac. Islander | 19 | 0.32% |
93501 Public School Race/Ethnicty Breakdown
| Race/Ethnicty | Total | Percentage |
|---|
| White | 85 | 11.29% |
| Black | 218 | 28.95% |
| Hispanic | 438 | 58.17% |
| Asian | 3 | 0.4% |
| Native American | 8 | 1.06% |
| Hawaiian/Pac. Islander | 1 | 0.13% |
93501 Educational Attainment Levels
| Highest Education Level Attained | Total | Percentage |
|---|
| Less Than 1 Year of College | 247 | 10.31% |
| Bachelor Degree | 149 | 6.22% |
| High School Diploma | 936 | 39.08% |
| No High School Diploma | 106 | 4.43% |
| GED or Alternate | 156 | 6.51% |
| 1 or More Years of College | 585 | 24.43% |
| Associates Degree | 151 | 6.3% |
| Masters Degree | 65 | 2.71% |
| Professional Degree | 0 | 0% |
| Doctorate Degree | 0 | 0% |