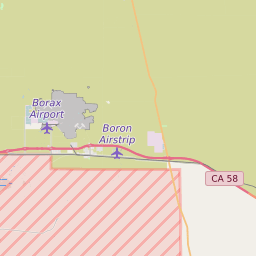
93560 can be classified socioeconomically as Lower Middle Class class compared to other ZIP Codes in California based on Median Household Income and Average Adjusted Gross Income. The majority race/ethnicity residing in 93560 is White. The majority race/ethnicity attending public schools in 93560 is Hispanic. The current unemployment level in 93560 is 5.0%.
| Population | 21,300 |
| Population Growth Rate | 0.00% |
| Population Density | 60 People per Square Mile |
| Total Households | 5,829 |
| Percentage High Income Households | 1.1% |
| Median Household Income (2021) | $70,119 |
| Average Adjusted Gross Income (2021) | $274,200 |
| Current Unemployment Rate (June 2025) | 5.0% |
| Majority Race/Ethnicty | White - 53.31% |
| Public School Majority Race/Ethnicty | Hispanic - 59.48% |
93560 Race/Ethnicty Breakdown
| Race/Ethnicty | Total | Percentage |
|---|
| White | 13,263 | 53.31% |
| Black | 2,078 | 8.35% |
| Hispanic | 9,144 | 36.75% |
| Asian | 218 | 0.88% |
| Native American | 177 | 0.71% |
| Hawaiian/Pac. Islander | 0 | 0% |
93560 Public School Race/Ethnicty Breakdown
| Race/Ethnicty | Total | Percentage |
|---|
| White | 839 | 26.1% |
| Black | 300 | 9.33% |
| Hispanic | 2,002 | 62.29% |
| Asian | 52 | 1.62% |
| Native American | 15 | 0.47% |
| Hawaiian/Pac. Islander | 6 | 0.19% |
93560 Educational Attainment Levels
| Highest Education Level Attained | Total | Percentage |
|---|
| Less Than 1 Year of College | 1,064 | 11.66% |
| Bachelor Degree | 1,026 | 11.24% |
| High School Diploma | 2,983 | 32.68% |
| No High School Diploma | 323 | 3.54% |
| GED or Alternate | 384 | 4.21% |
| 1 or More Years of College | 1,937 | 21.22% |
| Associates Degree | 1,065 | 11.67% |
| Masters Degree | 282 | 3.09% |
| Professional Degree | 35 | 0.38% |
| Doctorate Degree | 29 | 0.32% |