ZIP Code 93944 Quick Stats
| ZIP Code Name | Monterey |
| Primary County | Monterey County |
| ZIP Code Type | PO Box |
| Population (2022) | 2,605 |
| Area Code(s) | 831 |
| Current Time | 11:34:05 PM |


93944 Demographics
The majority race/ethnicity residing in 93944 is White. The current unemployment level in 93944 is 5.3%.
| Population | 2,605 |
| Population Growth Rate | 0.00% |
| Population Density | 5,585 People per Square Mile |
| Current Unemployment Rate (January 2025) | 5.3% |
| Majority Race/Ethnicty | White - 75.10% |
93944 Race/Ethnicty Breakdown
| Race/Ethnicty | Total | Percentage |
|---|---|---|
| White | 1,550 | 75.1% |
| Black | 78 | 3.78% |
| Hispanic | 266 | 12.89% |
| Asian | 141 | 6.83% |
| Native American | 29 | 1.41% |
| Hawaiian/Pac. Islander | 0 | 0% |
93944 Educational Attainment Levels
| Highest Education Level Attained | Total | Percentage |
|---|---|---|
| Less Than 1 Year of College | 19 | 4.11% |
| Bachelor Degree | 137 | 29.65% |
| High School Diploma | 27 | 5.84% |
| No High School Diploma | 7 | 1.52% |
| GED or Alternate | 0 | 0% |
| 1 or More Years of College | 103 | 22.29% |
| Associates Degree | 141 | 30.52% |
| Masters Degree | 28 | 6.06% |
| Professional Degree | 0 | 0% |
| Doctorate Degree | 0 | 0% |
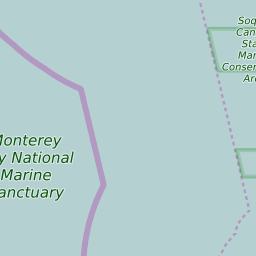
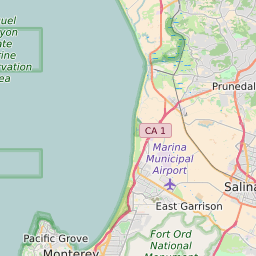
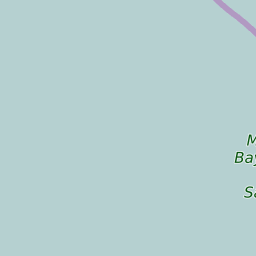
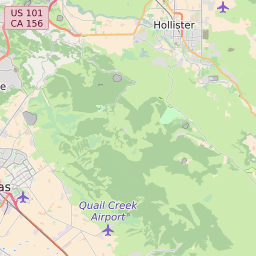
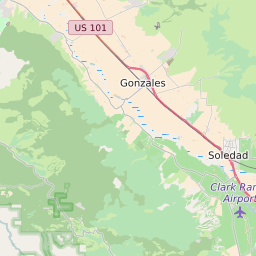
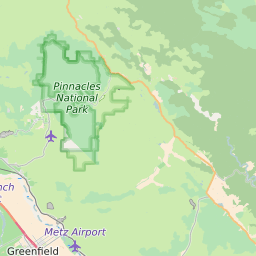
93944 Geography
| Coordinates | 36.60234070,-121.91497803 |
| Adjacent ZIP Codes | |
| Region | Monterey-Salinas Area |
| Metropolitan/Micropolitan Stat Area | Salinas, CA |
| Time Zone | Pacific Standard Time |
| IANA Timezone | America/Los_Angeles |
| Area | 0.46644493 Square Miles |
93944 Schools
| School Districts in 93944 | |
| Elementary Schools in 93944 | |
| Middle Schools in 93944 | |
| High Schools in 93944 |
93944 Weather and Climate Data
| Plant Hardiness Zone | Zone 10a: 30F to 35F | ||||||||||||||||||||||||||||||||||||||||||||||||||||||||||||||||||||||
| Average First Frost Date | January 21 - 31 | ||||||||||||||||||||||||||||||||||||||||||||||||||||||||||||||||||||||
| Average Last Frost Date | January 1 - 10 | ||||||||||||||||||||||||||||||||||||||||||||||||||||||||||||||||||||||
| Koppen-Geiger Climate Zone | Csb - Warm-Summer Mediterranean Climate | ||||||||||||||||||||||||||||||||||||||||||||||||||||||||||||||||||||||
| Ecoregion | |||||||||||||||||||||||||||||||||||||||||||||||||||||||||||||||||||||||
| |||||||||||||||||||||||||||||||||||||||||||||||||||||||||||||||||||||||